For any professional working with Linux system administration—whether you are a Cloud Architect, automation specialist, or DevOps enthusiast—the ability to monitor system performance in real time is essential.
For decades, the top command has been the default Swiss Army knife, present in virtually every Linux distribution. However, more modern and feature-rich tools such as Glances have emerged as powerful alternatives.
But which one is the best for your use case? In this article, we dive into a detailed comparison between Glances and top to help you decide which tool best fits your monitoring and performance optimization needs.
The Gold Standard: top
The top (table of processes) command is essential and robust. It provides a dynamic, real-time view of processes running on a system.
When you run top in your terminal, you immediately get an overview of CPU usage, memory consumption, system uptime, and an interactive list of the processes consuming the most resources.
Key Advantages of top:
- Ubiquity: Pre-installed on most Linux systems.
- Lightweight: Consumes almost no resources.
- Simplicity and Focus: Displays the essentials quickly.
- Basic Interactivity: Sort by CPU (
P), memory (M), or kill processes (k).
Practical Examples:
Sort processes by CPU:
top -o %CPUSort processes by memory:
top -o %MEM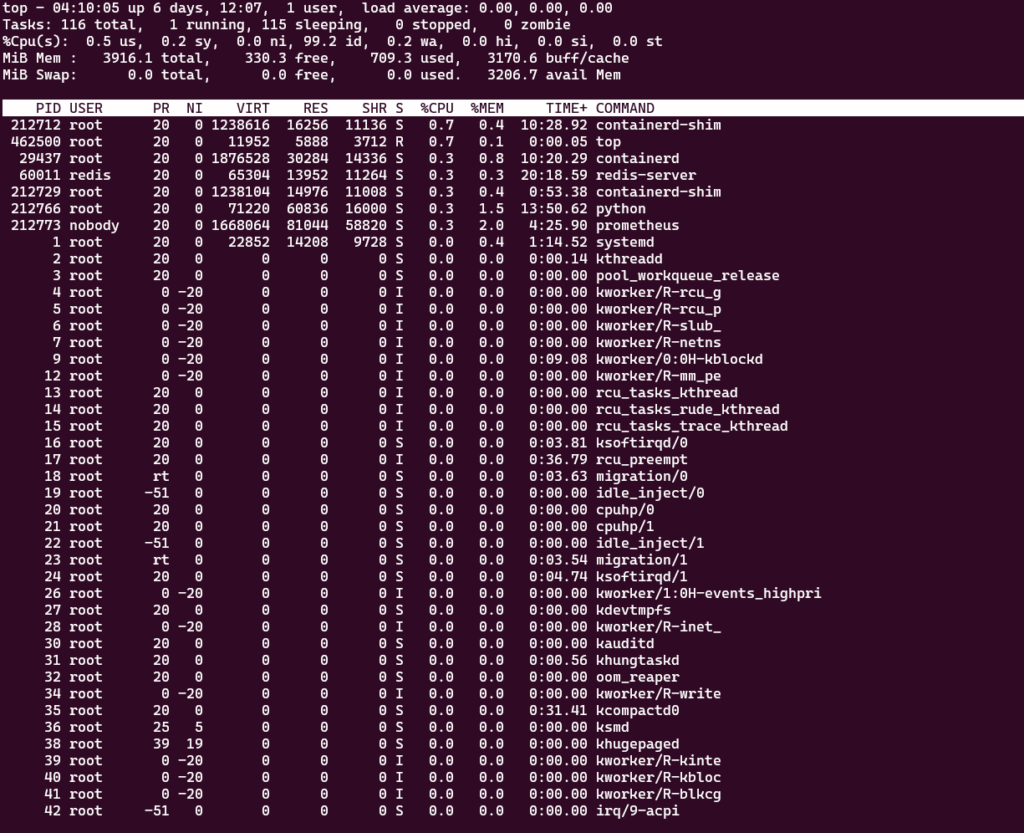
The Modern Alternative: Glances
Glances is a cross-platform system monitoring tool written in Python. It describes itself as “a top with steroids”, and that is an accurate description.
Glances provides an impressive amount of information on a single screen, organized and color-coded.
Key Advantages of Glances:
- All-in-One View: CPU, memory, load average, disk I/O, network activity, processes, Docker containers, hardware sensors.
- Alerts and Thresholds: Color-coded warnings for metrics exceeding thresholds.
- Web and Client/Server Mode: Remote monitoring via browser or terminal client.
- Data Export: Supports InfluxDB, Prometheus, and easy integration with Grafana.
- Container Support: Native detection of Docker containers.
Practical Examples:
Install via pip:
pip install glancesRun in the terminal:
glances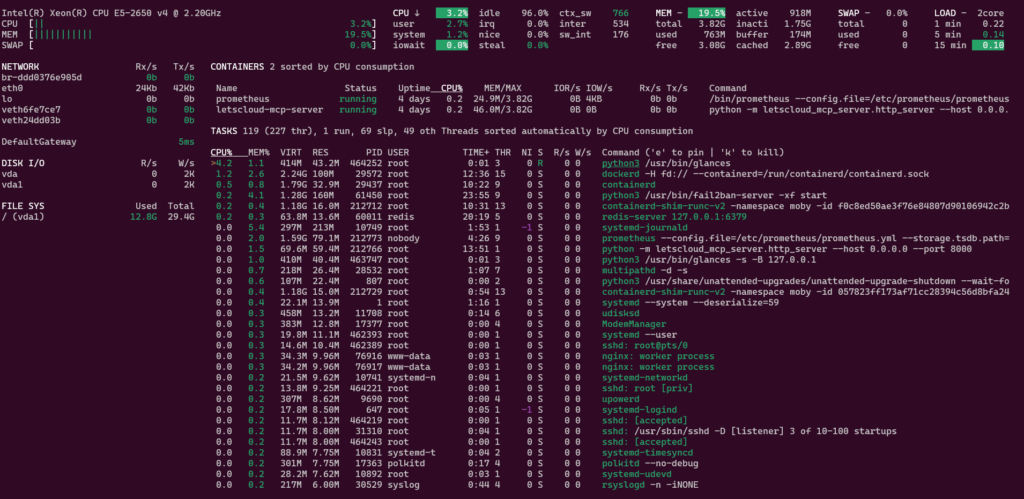
Side-by-Side Comparison: Glances vs top
| Feature | top | Glances |
|---|---|---|
| Installation | Pre-installed on most Linux systems | Requires installation (pip install glances) |
| Overview | CPU, Memory, Processes | CPU, Memory, Disk, Network, Sensors, Containers |
| Interface | Simple text, monochrome | Color-coded, organized, with alerts |
| Resource Usage | Very low | Low to moderate |
| Remote Monitoring | Via SSH | Native (web mode / client-server) |
| Data Export | Not available | Supports InfluxDB, Prometheus, etc. |
| Best For | Quick diagnosis, minimal environments | Complete monitoring, modern cloud/containerized environments |
Conclusion: Which Tool Should You Use?
Choosing between Glances and top is not about which is “better” in absolute terms, but rather about the right tool for the right job.
✅ Use top when:
- You need a quick CPU/memory check.
- You’re in a restricted environment (minimal containers, embedded systems).
- You want an ultra-lightweight tool with almost zero impact.
✅ Use Glances when:
- You want a complete, consolidated view of your system’s health.
- You manage complex cloud infrastructure with containers.
- You need proactive alerts or data export to Prometheus/Grafana.
For modern cloud and automation specialists, Glances becomes indispensable.
Meanwhile, top remains the go-to tool for quick and reliable diagnostics.
👉 Recommendation: Always keep top for emergencies, but adopt Glances for daily, comprehensive monitoring.